Data-driven
Curious about the growth our students were making in the current (2020-2021) school year, we calculated student-specific growth rates across all A2i first-grade classrooms. Specifically, we measured the change in literacy level between each student's first assessment of the year, and their most recent one (this difference reflects growth). Additionally, we calculated the duration between tests to use as the denominator in our rate calculations (growth/time).
One key strength of our evaluations is that they have been rigorously linked to 'Grade Equivalent' measures. As an aggressive baseline for comparison, we expect students to make growth of 0.9 Grade Equivalent over the course of a typical, 9 month school year. This baseline expectation equates to a case where a student is growing at least 0.1 GE/month over the school year (or 0.9 GE/9 months). This 'baseline' was derived for typical school years and instructional practices, however, and the multiple and far-reaching impacts of CV19 on literacy education this year are varied and widespread. In spite of these impacts, we found that 1st grade students across A2i classrooms were growing at an average rate of 0.8636 GE/9 months in the current school year. The difference between our baseline expectation (0.9) and our observed growth rate (0.8368) was then multiplied by 30.33 days (an average number of days/month for Sept-May) to obtain a difference of 11.04 days 'learning loss' (which is about 1.5 weeks).

Research-based literacy instruction boosts learning at scale
first posted: May XX, 2021
Learning Ovations’ work to expand our impact and improve childhood literacy rates at scale began in the fall of 2018. Specifically, our partner districts and schools began using research-based literacy instruction via our A2i platform in 1st grade classrooms that year (2018-2019), expanded to 2nd grade the following year (2019-2020), and included 3rd grade in the current (2020-2021) school year. Thus, many of the current 3rd graders in A2i classrooms have been exposed to differentiated literacy instruction for several years and tracking these students’ growth over time provides a meaningful way to evaluate the efficacy of Learning Ovations’ instructional tools and partnerships.
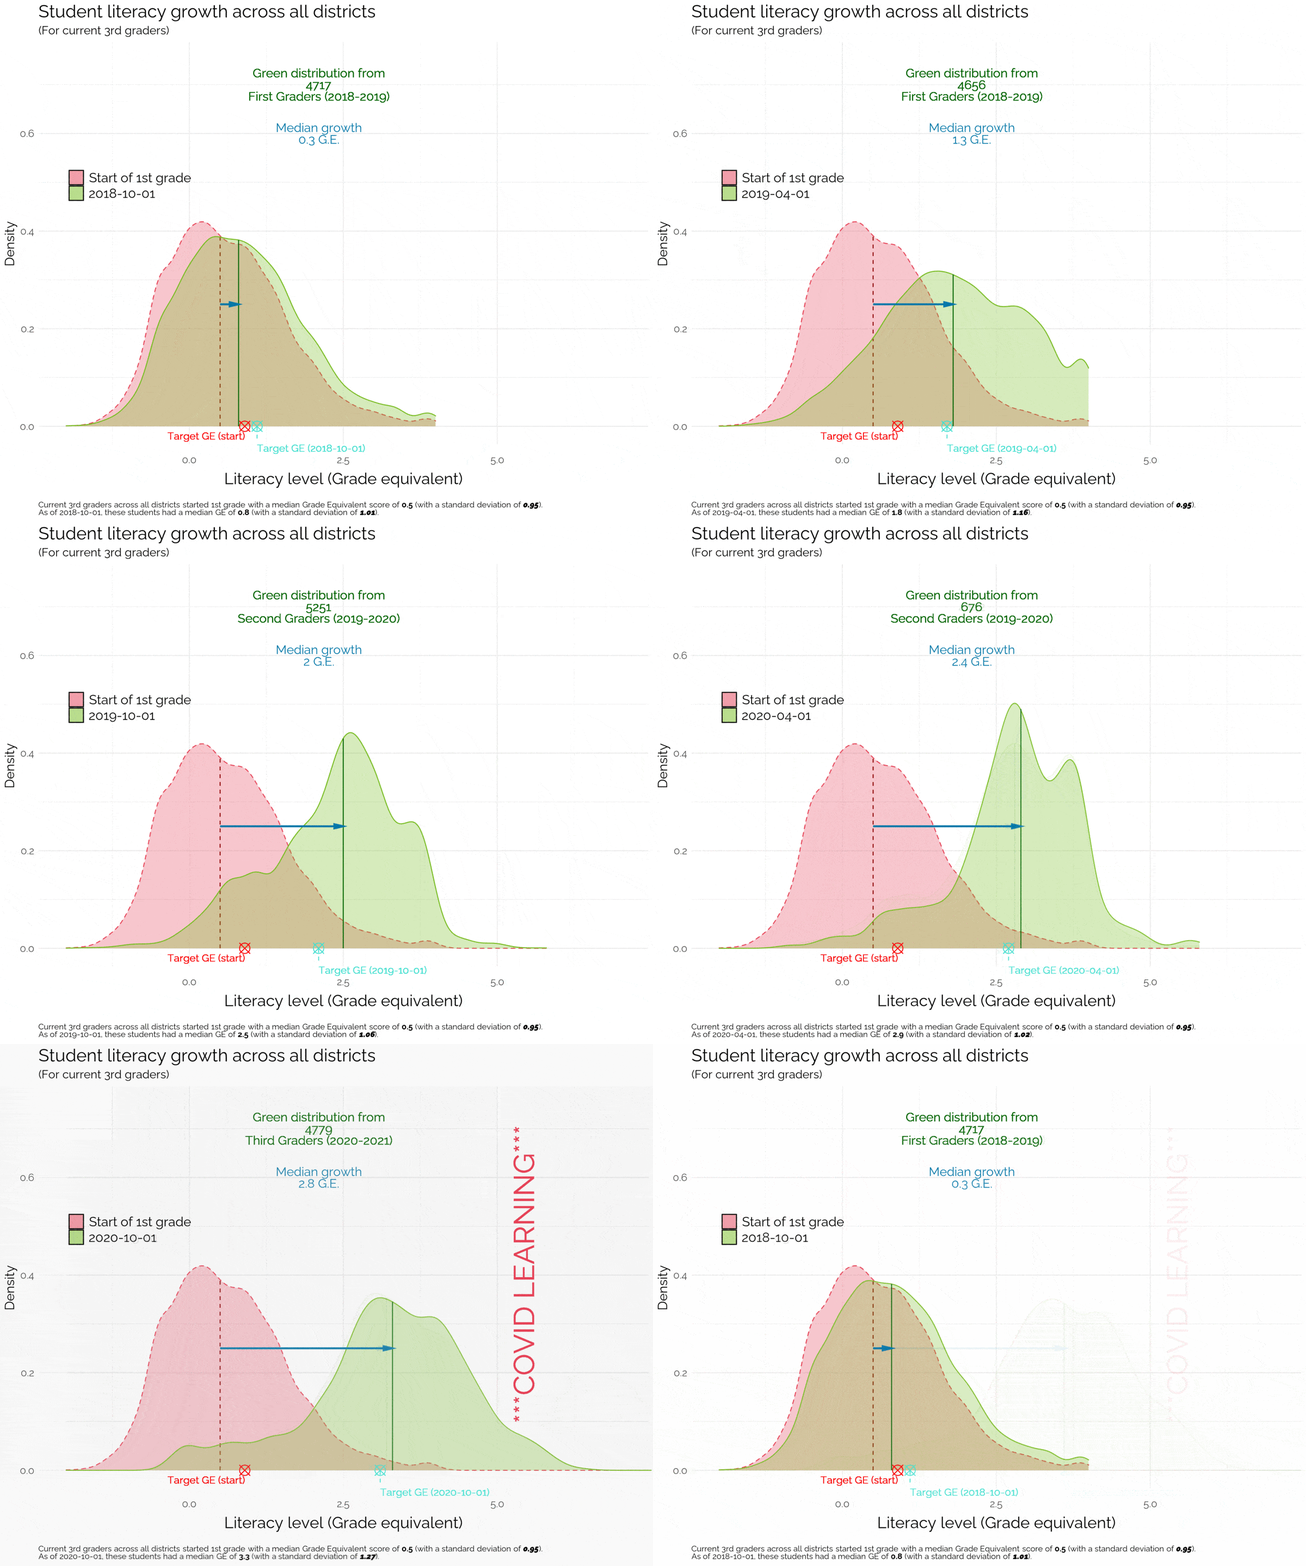
In the dynamic visualization shown here, we can see how the student literacy levels change over time across 90 partner schools, in 17 districts, across 4 states. To give a realistic sense of how partnership with Learning Ovations and the adoption of A2i-facilitated differentiated literacy instruction can shift populations of students towards success, these data include all students – including those who enter ‘late’ (any time after the fall of 2018), leave ‘early’ (any time before the current testing window), or any combination thereof. Just as administrators and decision-makers serve diverse student populations, our data encompass diverse populations that include many students of color (80% of students in our partner schools), students with Limited English Proficiency (38% of students in our partner schools), and students from economically disadvantaged backgrounds (77% of students in our partner schools qualify for Free & Reduced Lunch).
The curves in each frame of this visualization indicate the relative # of students at a given literacy level, with higher parts of the curve indicating a larger proportion of students with a GE at that level. When students in A2i began 1st grade (red curve), they had a median GE of 0.5, indicated by the dashed vertical red line. Students would be expected to start 1st grade with a GE of 1.0, indicating that the median A2i student was roughly 5 months behind at the start of 1st grade. As students developed and learned, their literacy levels grew – month-by-month (the green curves), pushing the GE distribution to the right. For example, we can see that by the end of 1st grade (June 2019), the median GE of A2i students was 2.0 – indicating a growth rate of 150% ‘baseline’ and that the median student was on track to begin 2nd grade.
Because assessment windows are variable across schools, districts, and states, each ‘monthly’ distribution includes scores +/- 45 days from the start of the given month. That means each distribution includes scores taken in a 90-day window, centered on the start of the month. The overlap in data between months has the added benefit of providing additional smoothing between consecutive time intervals and ensuring a robust sample size at every time-point sampled between September 2018 and March 2021.

